A 24-channel engineering seismograph with 4.5 Hz vertical geophones laid out across a site near the Chicago River—that’s how a seismic tomography survey typically starts here. The crew strings out a 115-meter spread, hits a 16-pound sledgehammer on an aluminum plate, and the recording unit captures P-wave arrivals in 0.125-millisecond intervals. In a city where the glacial till sits above dolomitic limestone at depths that swing from 20 to 100 feet, refraction surveys map the bedrock surface reliably. When a developer needs to know whether the Paleozoic rock is continuous or fractured beneath a planned high-rise in the Loop, we pair the refraction line with a short reflection spread to catch deeper anomalies. The equipment is rugged enough for a muddy lot in Bridgeport just as much as a tight alley in Lincoln Park, and the data feed directly into velocity models used for seismic microzonation studies when ASCE 7 site class determination is on the line.
Velocity contrasts between glacial till and dolomitic bedrock in Chicago are sharp enough that seismic tomography resolves the interface within ±3 feet vertically, even in high-noise urban settings.
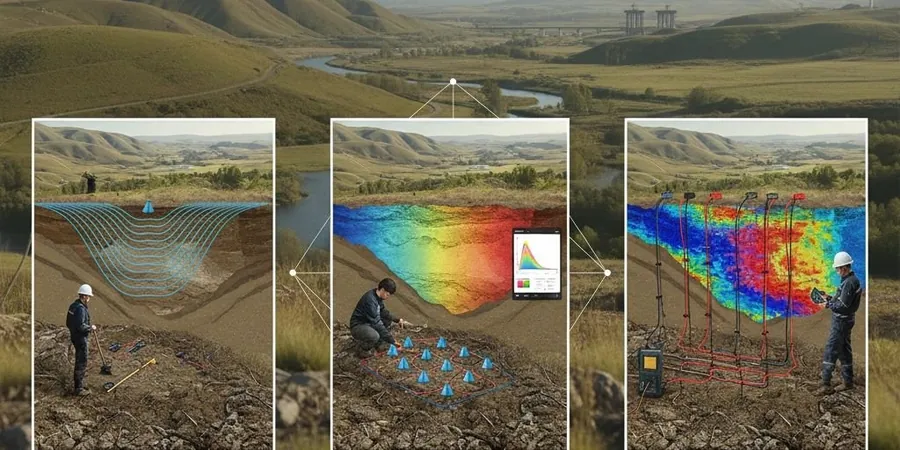
Methodology and scope
Around Chicago we often notice that the top 8 to 15 feet of glacial clay and urban fill can mask a lot of what lies underneath. Standard penetration tests tell you what’s in the borehole, but seismic tomography fills the gaps between drill points. A typical refraction survey with five geophone spreads across a half-acre lot produces a 2D P-wave velocity cross-section that distinguishes stiff till—running 1,200 to 2,000 m/s—from weathered limestone below 3,000 m/s. The method works well even with the ambient noise of the CTA train rumbling a block away, because we stack multiple hammer blows and apply bandpass filters tuned to the 20–80 Hz range. Reflection tomography adds value when the target is deeper than 100 feet, using a 40-pound accelerated weight drop as the source. The processed data yield interval velocities that feed into Poisson’s ratio estimates when combined with shear-wave surveys.
In practice, the output most requested by structural engineers is a contoured bedrock elevation map plus a seismic site class letter—usually C or D in Chicago—backed by Vs30 values derived from the tomography line.
Frequently asked questions
How much does a seismic tomography survey cost in Chicago?
For a typical half-acre commercial lot in the Chicago area, a refraction tomography survey with 5 to 6 spreads runs between US$2,550 and US$4,840, depending on access conditions, line length, and whether reflection data are added. Sites with heavy traffic control requirements or night-work permits push toward the upper end.
Can seismic tomography detect voids under Chicago streets?
Yes, within limits. Air-filled voids in dolomitic limestone produce a sharp velocity drop and sometimes a diffraction hyperbola on the shot gathers. The resolution is on the order of 3 to 5 feet for a cavity at 30-foot depth. Reflection tomography is better than refraction for void detection because the target contrast is negative. We often recommend pairing tomography with electrical resistivity for confirmation.
How does seismic tomography compare to MASW for site classification?
Refraction tomography gives a P-wave velocity model that maps layer geometry well, but MASW is the standard for direct Vs30 measurement for IBC site class. In Chicago we frequently run a single MASW spread alongside the refraction lines—the refraction maps the bedrock surface and the MASW provides the shear-wave velocity profile needed for ASCE 7 Table 20.3-1 classification. The two techniques are complementary, not interchangeable.